Approaching The Top Benefits The Bottom
By Robert Mandelbaum and Gary McDade

Much has been written about the strong top-line performance of the U.S. lodging industry since the Great Recession. According to STR, Inc, national occupancy levels increased from 54.5 percent in 2009 to 62.2 percent in 2013, while average daily room rates grew from $98.21 to $110.34. The net result was a 28.1 percent increase in RevPAR over the five year period. Based on the June 2014 edition of our Hotel Horizons® forecast report, by year-end 2014, PKF Hospitality Research, LLC (PKF-HR) is projecting that RevPAR levels will reach pre-recession levels for all six national chain-scale segments. This indicates that the industry is beyond the recovery stage and well into a period of prosperity.
While the revenue recovery has been well documented, hotel owners, investors, and lenders are more interested in bottom-line performance. Based on PKF-HR'sTrends® in the Hotel Industry report, net operating income (NOI) for U.S. hotels has increased at a compound average growth rate (CAGR) of 10.7 percent from 2009 through 2013
To better understand hotel managers' ability to maximize profits during this period of increased revenues, PKF-HR studied the financial performance of thousands of hotels that voluntarily participated in its annual Trends® survey. For this analysis, NOI is defined as income before deductions for capital reserve, rent, interest, income taxes, depreciation, and amortization.
Flow Through
Using the Trends® data, we calculated the "NOI Flow Through" percentage, a key metric that is indicative of a hotel's ability to convert revenue growth into profits. According to the 11th Edition of the Uniform System of Accounts for the Lodging Industry, Flow Through is defined as, "the percentage of incremental profit that flows to the bottom-line from each incremental dollar of topline revenue." The NOI Flow Through percentage is calculated as follows:
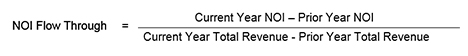
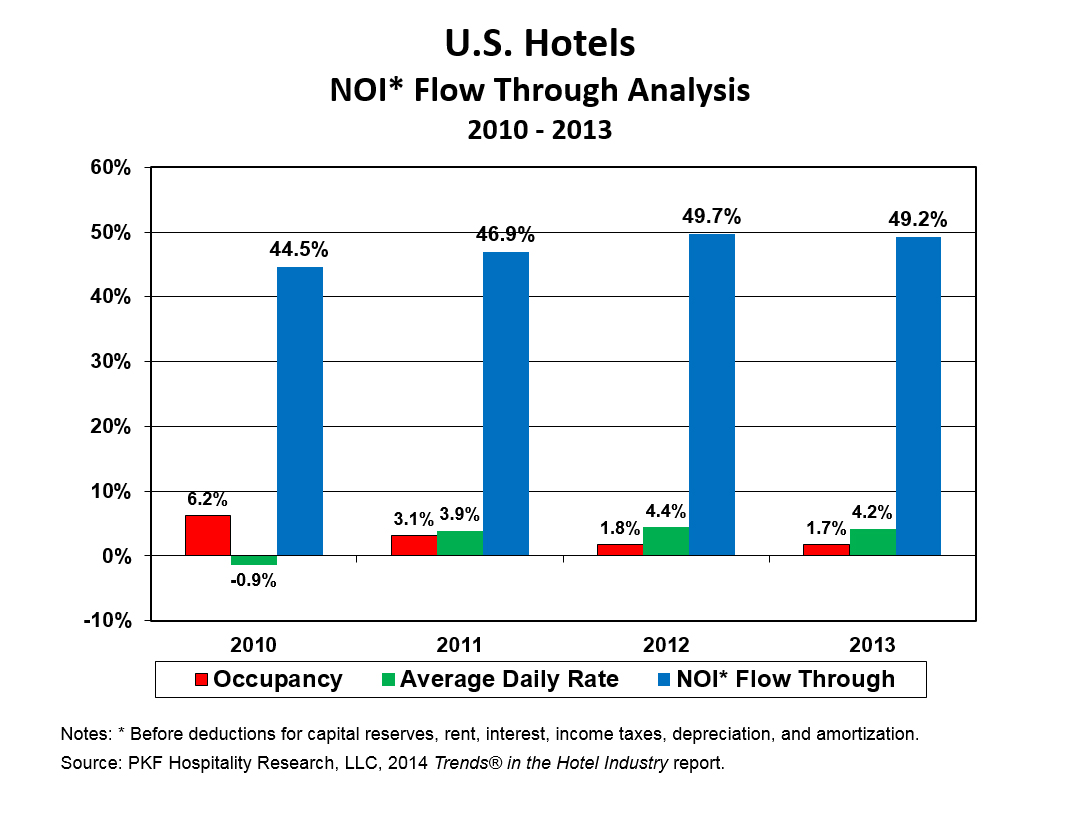
NOI Flow Through increased from 44.5 percent in 2010 to 49.2 percent in 2013. In other words, every dollar of new revenue earned in 2010 generated 44.5 cents in profits. In 2013, this ratio improved to 49.2 cents in profit per dollar of new revenue.
This increase in NOI Flow Through is due in part to the changing mix of the forces that drive RevPAR. Prior research conducted by PKF-HR has found that changes in ADR have a 20 percent greater impact on profit growth, compared to changes in occupancy. In 2010, the 5.3 percent RevPAR increase was due to a 6.2 percent increase in occupancy accompanied by a 0.9 decrease in ADR. Conversely, the 2013 RevPAR increase of 5.9 percent was mostly driven by ADR (4.2%) as opposed to occupancy (1.7%).
Chain-Scale Flow
To provide greater insights into hotel profitability, we analyzed the 2013 performance of four chain scales: luxury, upper-upscale, upscale, and upper-midscale. Midscale and economy properties were excluded from this analysis due to sample size and comparability issues.
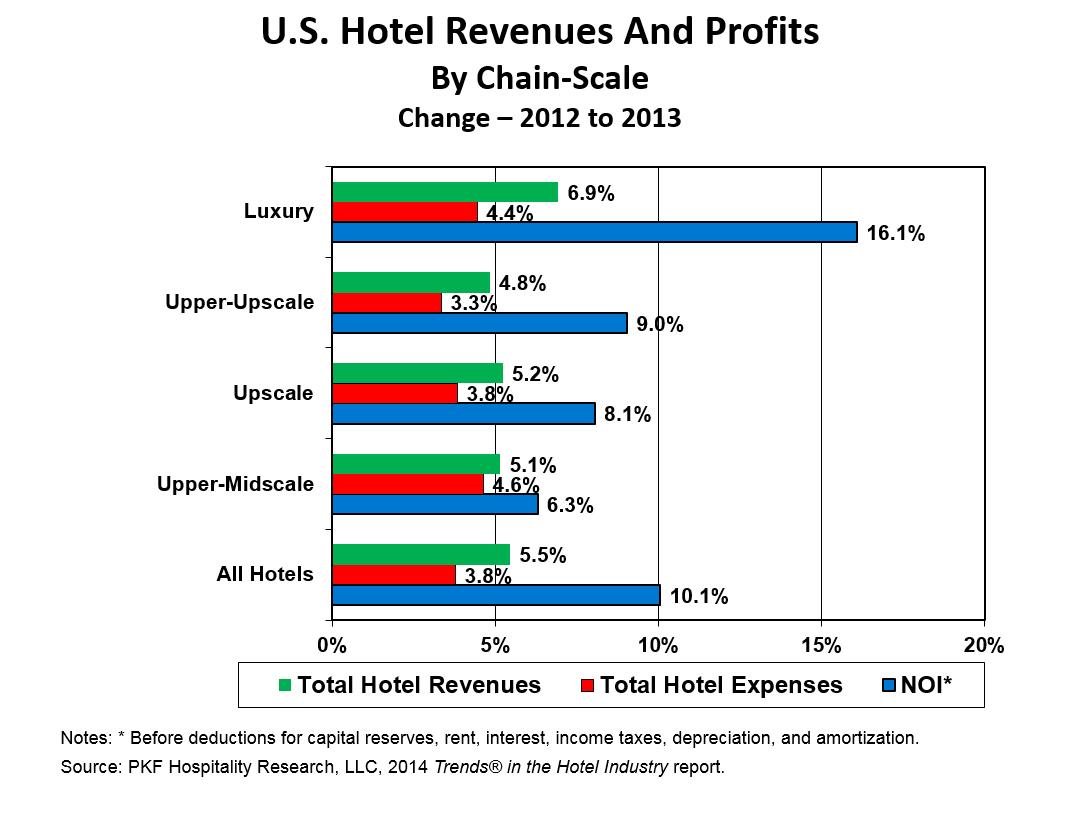
NOI for the average hotel in our Trends® sample grew by 10.1 percent in 2013. As we have written in the past, upper-priced hotels have recovered far better than lower-priced from a revenue standpoint. This has also been true from a profit standpoint. Luxury hotels achieved the greatest gain in NOI (16.1%) in 2013, followed by upper-upscale (9.0%) and upscale (8.1%) properties. Upper-midscale properties showed the least profit growth (6.3%) among the four categories during the year.
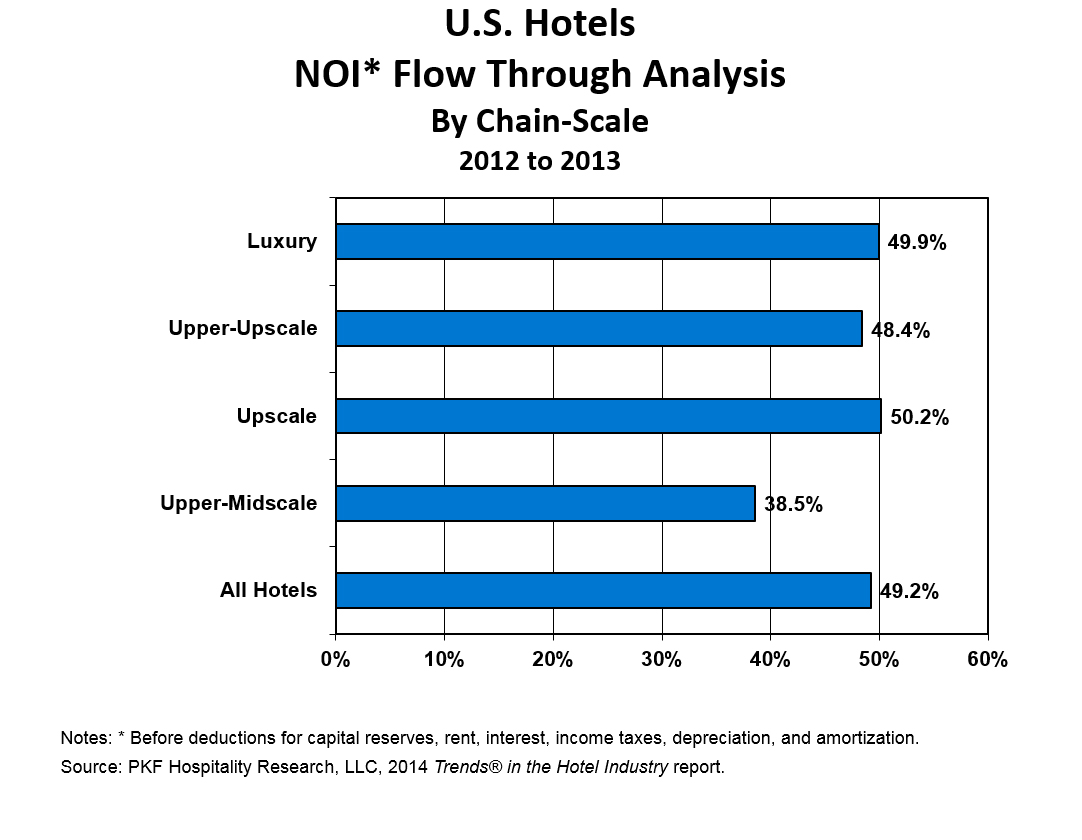
Luxury hotels were able to achieve an NOI Flow Through of 49.9 percent in 2013 because strong revenue growth offset significant increases in expenses. During the year, luxury hotel expenses grew a relatively high 4.4 percent because these hotels need to offer greater levels of amenities and services. Fortunately, luxury guests value the extra service levels and will pay premium rates. A 5.2 percent increase in luxury hotel ADRs helped fuel the 6.9 percent growth in total revenue for this category.
The NOI Flow Through for upper-upscale properties was 48.4, while upscale was 50.2 percent. Contrary to luxury properties, the profit growth for these two segments was mainly a function of cost control. Total hotel expenses at upper-upscale properties grew at only 3.3 percent, while upscale hotel expense increased by 3.8 percent. Hotels in both of these segments were particularly able to control the growth in undistributed expenses, as well limiting labor cost increases.
Upper-midscale properties posted the lowest NOI Flow Through percentage in 2013. For the year, properties in this category achieved a Flow Through of just 38.5 percent. Although the total revenue growth (5.1%) at these properties was similar to upper-upscale and upscale properties, RevPAR increases were more a function of increasing occupancy than ADR growth. Thus, upper-midscale hotel managers were more challenged to control expenses. Total hotel expenses grew by 4.6 percent which was largely due to a 4.4 percent increase in total labor costs. This was the highest labor cost increase among the chain scales studied.
Profit Sweet Spot
According to PKF-HR's June 2014 Hotel Horizons® forecast, RevPAR gains in 2014 and 2015 will be highly influenced by ADR increases. This puts U.S. hotels in the sweet spot of Flow Through and profits. As the U.S. lodging industry climbs towards the top of the current business cycle, hotels will enjoy significant benefits on the bottom-line.